How to Optimize Cost of AWS Lambda using Influxdb and Grafana
Getting started with Lambda is easy - you don’t have to provision any infrastructure and it’s very cheap to have something useful up and running. But t’s very easy to start with inefficiencies that go unnoticed.

Agenda
- What is Lambda?
- How to optimize the cost?
- Why I need a tool?
- Architecture / Grafana & InfluxDB & AWS Cost Explorer
- How it work?
What is Lambda
AWS Lambda is a serverless computing serivce in AWS cloud. It lets you run code without handling or managing any thing about servers. Just upload your code and Lambda will take care of anything required to run and scale it. And it can trigger other aws service or call it by http.
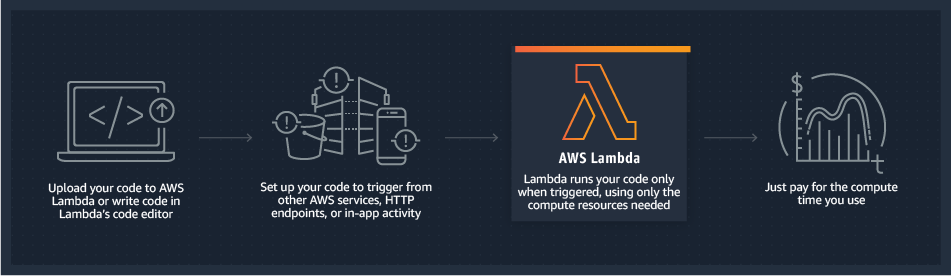
You pay only for the compute time you consume - there is no charge when your code is not running.
There are many use cases: Data Processing, Mobile Backends, Web Apps, etc.
But there is one very important risk. Since it’s so easy and cheap to get started with Lambda, it’s very common to forget about cost during development. But once you start running some serious workloads and many functions, cost can be significant. If you don’t optimize and estimate Lamba cost early, your Lambda functions can unnecessarily cost you thousands of dollars. That’s money that you could use in other important areas of your business.
So it's important to track the cost of Lambda functions and keep it under control.
How to optimize the cost
First, let's take a look about the how lambda pricing
With AWS Lambda, you pay only for what you use. You are charged based on the number of requests for your functions and the duration, the time it takes for your code to execute.
Here is an example form AWS:
If you allocated 512MB of memory to your function, executed it 3 million times in one month, and it ran for 1 second each time, your charges would be calculated as follows:

Monthly compute charges

The monthly compute price is $0.00001667 per GB-s and the free tier provides 400,000 GB-s.

Total compute (seconds) = 3M * (1s) = 3,000,000 seconds

Total compute (GB-s) = 3,000,000 * 512MB/1024 = 1,500,000 GB-s

Total compute – Free tier compute = Monthly billable compute GB- s

1,500,000 GB-s – 400,000 free tier GB-s = 1,100,000 GB-s

Monthly compute charges = 1,100,000 * $0.00001667 = $18.34


Monthly request charges

The monthly request price is $0.20 per 1 million requests and the free tier provides 1M requests per month.
Total requests – Free tier requests = Monthly billable requests

3M requests – 1M free tier requests = 2M Monthly billable requests

Monthly request charges = 2M * $0.2/M = $0.40


Total monthly charges
Total charges = Compute charges + Request charges = $18.34 + $0.40 = $18.74 per month
These 3 factors really matter to total cost of lambda:
- Number of executions
- Duration of each execution
- Memory allocated to the function
how to keep aws lambda cost down
Here are some ways in which you can keep your Lambda cost down:
1. Make sure your functions are executed at the right frequency
Some factors can affect how frequently your Lambda function is triggered. Such as the batch size of SQS or Kinese which trigger your lambda.In fact, the request cost is quite small part of the lambda.
2. Write efficient code that executes fast
Since execution duration is directly proportional to how much you’ll pay, it’s important to track the Duration metric. If you see your function is taking suspiciously long to complete, then it’s time to look at ways to optimize it.
3. Provision the right amount of memory
Avoid a record like this in your Lambda function’s logstream:
Duration: 702.16 ms Billed Duration: 800 ms Memory Size: 1000 MB Max Memory Used: 273 MB
This function is using 273MB in this execution. But it has 1000MB Provision Memory. You will pay the bill for the Over Provisioned Memory. It means you are wasting your money on the capacity you don't use. If you reduce the provisioned memory size to 500MB, you'd be save half of your cost on this lambda, instead of spending money on over-provisioned memory.
Why you need a tool
One of the main reasons for choosing to move into the cloud is the ability to reduce costs. Therefore it’s essential to optimize how much you spend, so you only pay for what you need and only when you need it. Optimizing costs will help your organization get the most out of your investment, helping to meet demand and capacity while using the most economically useful options that AWS offers.
With a proper observability system in place your company will for sure minimize the risks that inherently come with serverless architectures. You will also have a way to manage the budget in a predictable manner.
This would include monitoring, tracking, analyzing, and alerting your service usage and with a trusted advisor, so you are able to provision your resources by keeping up with the best possible practices in order to improve system performance and reliability.
CloudWatch is an options. It will collect and track the metrics, monitor log files, and automatically respond to any changes made within your AWS resources.
Cost Explorer can help you with analyzing your usage and cost. It is a magnificent tool that allows you to get yor cost reports and usage trends.
But these doesn’t give you full insight into your system, or instant alerts when things break. For that you need a tool that will make sure to alert you instantly when your system is misbehaving. And your can bring together the benefits that AWS give you to optimize your cost.
Architecture
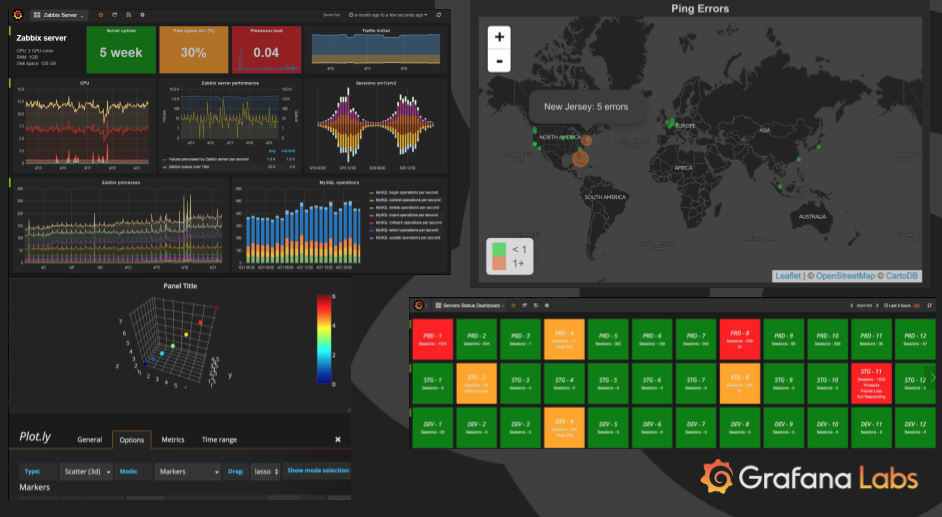
What is grafana
- Open source software for time series analytics
- Popular project and more company use it (intel,paypal,netapp…)
- Advanced , visualize and rich metrics dashboard
- Reporting and monitor server once 24 hours
- Alert Notification feature
InfluxDB
InfluxDB is the open source time series database designed to handle high write and query loads.
Writing data using the HTTP API
The HTTP API is the primary means of writing data into InfluxDB, by sending POST requests to the /write endpoint. The example below writes a single point to the mydb database. The data consist of the measurement cpu_load_short, the tag keys host and region with the tag values server01 and us-west, the field key value with a field value of 0.64, and the timestamp 1434055562000000000.
curl -i -XPOST 'http://localhost:8086/write?db=mydb' --data-binary 'cpu_load_short,host=server01,region=us-west value=0.64 1434055562000000000
Querying data using the HTTP API
The HTTP API is the primary means for querying data in InfluxDB.
To perform a query send a GET request to the /query endpoint, set the URL parameter db as the target database, and set the URL parameter q as your query. The example below uses the HTTP API to query the same database that you encountered in Writing Data.
curl -G 'http://localhost:8086/query?pretty=true' --data-urlencode "db=mydb" --data-urlencode "q=SELECT \"value\" FROM \"cpu_load_short\" WHERE \"region\"='us-west'"
InfluxDB returns JSON. The results of your query appear in the "results" array. If an error occurs, InfluxDB sets an "error" key with an explanation of the error.
{
    "results": [
        {
            "statement_id": 0,
            "series": [
                {
                    "name": "cpu_load_short",
                    "columns": [
                        "time",
                        "value"
                    ],
                    "values": [
                        [
                            "2015-01-29T21:55:43.702900257Z",
                            2
                        ],
                        [
                            "2015-01-29T21:55:43.702900257Z",
                            0.55
                        ],
                        [
                            "2015-06-11T20:46:02Z",
                            0.64
                        ]
                    ]
                }
            ]
        }
    ]
}
There many ways to load data to InfluxDB, such as REST API, Telegraf(a metrics collector made by influxdata), many service plugins, API client Libraries and many 3th party program suport InfluxDB as output(such as fluentd).
AWS Cost Explorer
AWS Cost Explorer, you can dive deeper into your cost and usage data to identify trends, pinpoint cost drivers, and detect anomalies.
- Directly access the data programmatically
- Dig deeper into your data by taking advantage of filtering and grouping functionality
- Set time interval and granularity
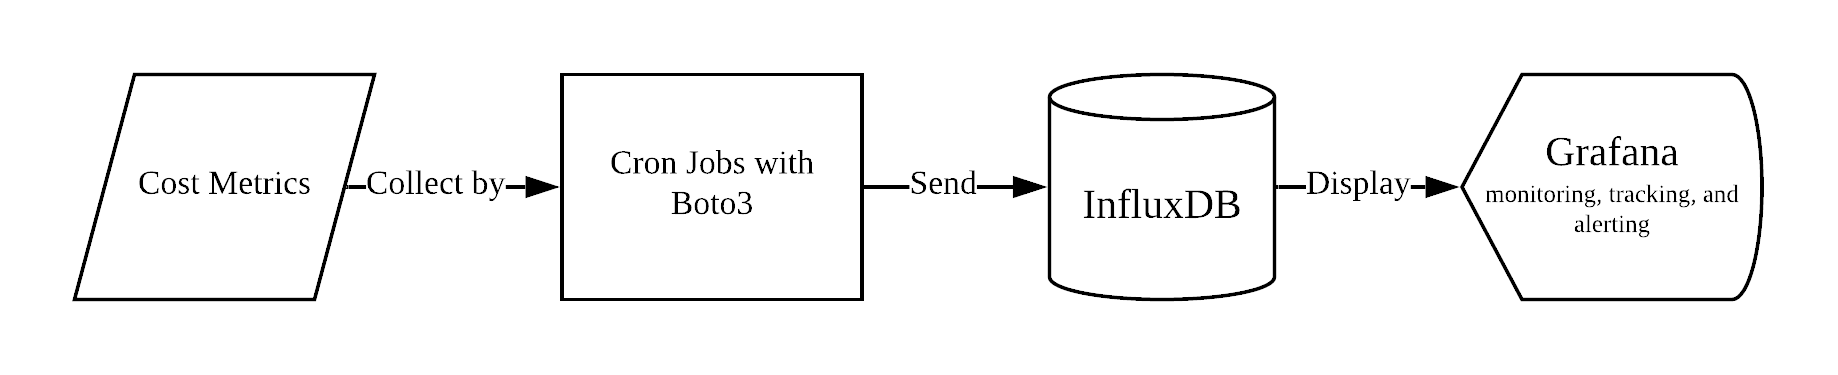
Data Flow
There serval cron jobs to collect cost metrics and infrastructure info from AWS using cost exporer api provided by Boto3. And then jobs will load these data into influxdb as timeseries data. The Grafana will be the monitor system to track, monitor analyze, and alert you when the metrics reach the threshold.
How it work
Using the cost data from aws, we could keep tracking the usage of each service and daily cost. Alert can be added to the system if we need.
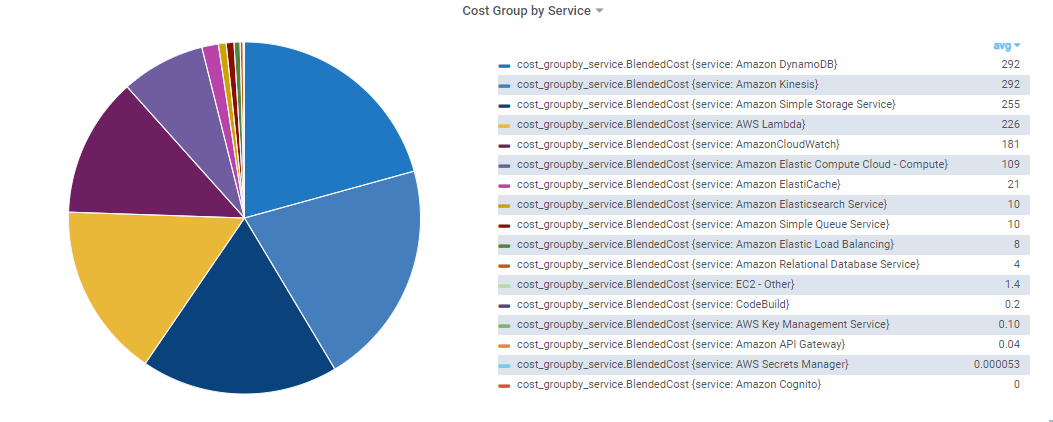
We can use the metrics to analyze the serivce's cost one by one from top one.
Use Lambda Optimization as Example:
We hava to prvision our lambda resources by keeping up with best performance and reliabliliry. The Over-Provisioned Memory is one import metrics for us to set the memory of lambda.
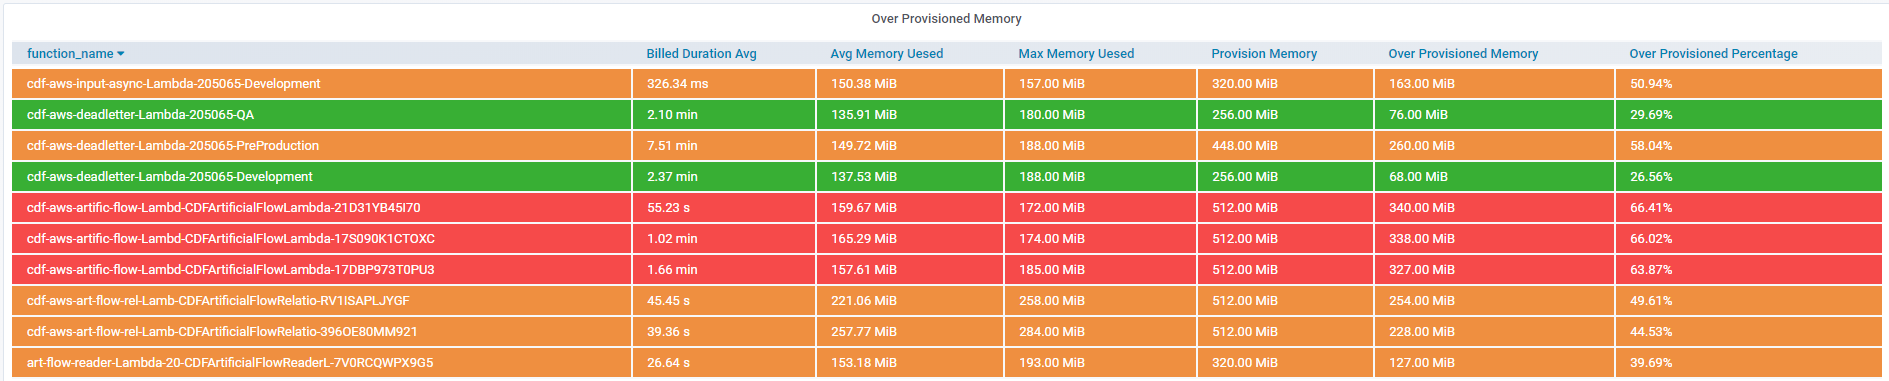
With the data, we could find out which lambda is in low-efficiency. This can be the advice which owner can use to update the lambda configurtion.
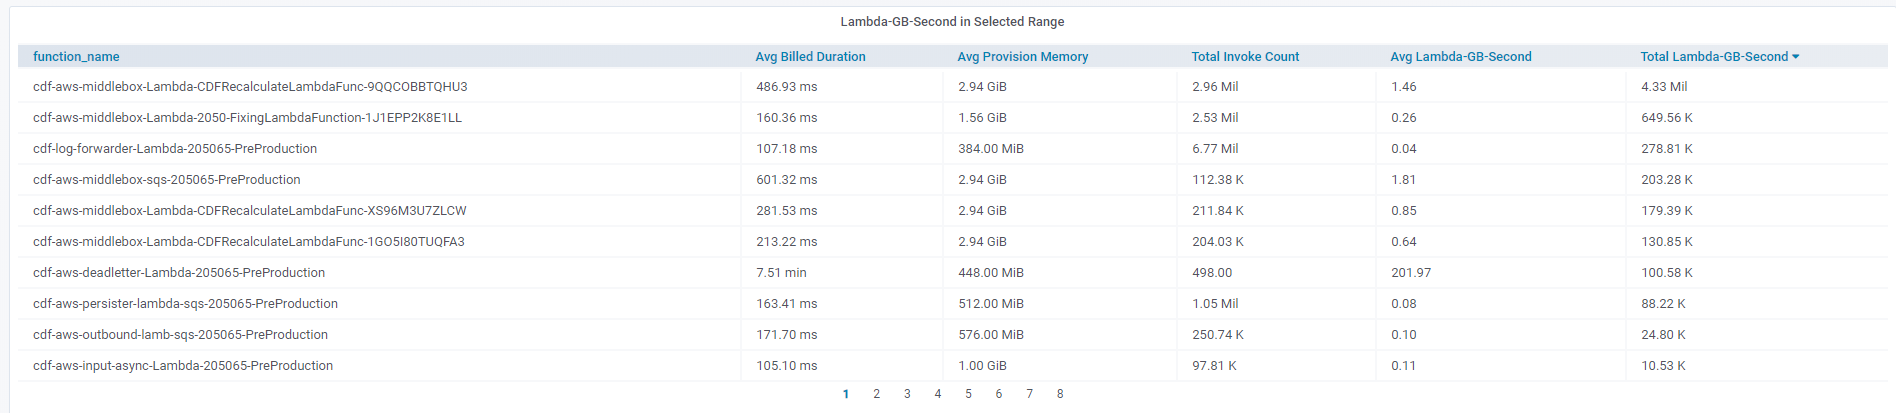
There is another table that list the usage of every lambda function in the scope. We can find out which Lambda is most expnsive or wich has the max invoke count. With these information, we can track the Lambda cost and usage to have a big view of our serverless system.
In common, after these data is collected and showed in this system, we can
touch to the owner has low-efficiency jobs, even automatic trigger them by the notification of Grafana. With the teams' effort, we could reach the best possible practices of cost optimization.
There are various choices to make and strategies to use to reduce the cost and optimise it to your own needs. The essential things you need to realise is to discover which of the given approaches best suit your personal needs. After finding out what you need, it’ll be much easier to choose a more personalised way to reduce the cost.
Conclusion
Getting started with Lambda is easy - you don’t have to provision any infrastructure and it’s very cheap to have something useful up and running. This is extremely powerful. But it’s also one of Lambda’s biggest risks. It’s very easy to start with inefficiencies that go unnoticed. That is, until your application handles some real volume and then those inefficiencies turn into very expensive situations.
That’s why it’s very important to keep track of Lambda cost and usage, before this becomes a problem.